Why gas prices could push up your interest rates
Pricier gas is pushing U.S. inflation back up. Here is how that can travel from the pump to the Federal Reserve, and on to your mortgage or credit-card bill.
 Illustration
Pricier gas is pushing U.S. inflation back up, and that could mean higher interest rates. Here's how that can reach your mortgage or credit-card bill.
The root chain
How Rootread connects the dots, in 6 steps.
- 1971
Nixon ended the dollar's link to gold, so keeping inflation in check fell more to the Fed.9
- 1973
An oil embargo nearly quadrupled oil prices, and high inflation took hold.10
- 1977
Congress told the Fed to aim for both maximum employment and stable prices.11
- 1979–81
After a second oil shock, Paul Volcker's Fed let the federal funds rate approach 20% to break inflation.12
- 2012
The Fed set a formal 2% inflation target.13
- 2026
Pricier gas pushed inflation to 3.7%, above that target, and the Fed raised rates in September.12
…which is why this is happening today.
1What's happening
- Prices rose 3.7% in the year to September, up from 3.4% in August, the Bureau of Labor Statistics reported Oct. 14.1
- Gasoline caused more than half of September's monthly rise.1
- Core inflation (which leaves out food and energy) was 2.6%.1
- Brent crude oil topped $110 a barrel this week as Yemen's Houthis claimed attacks on Saudi oil sites (CNBC).34
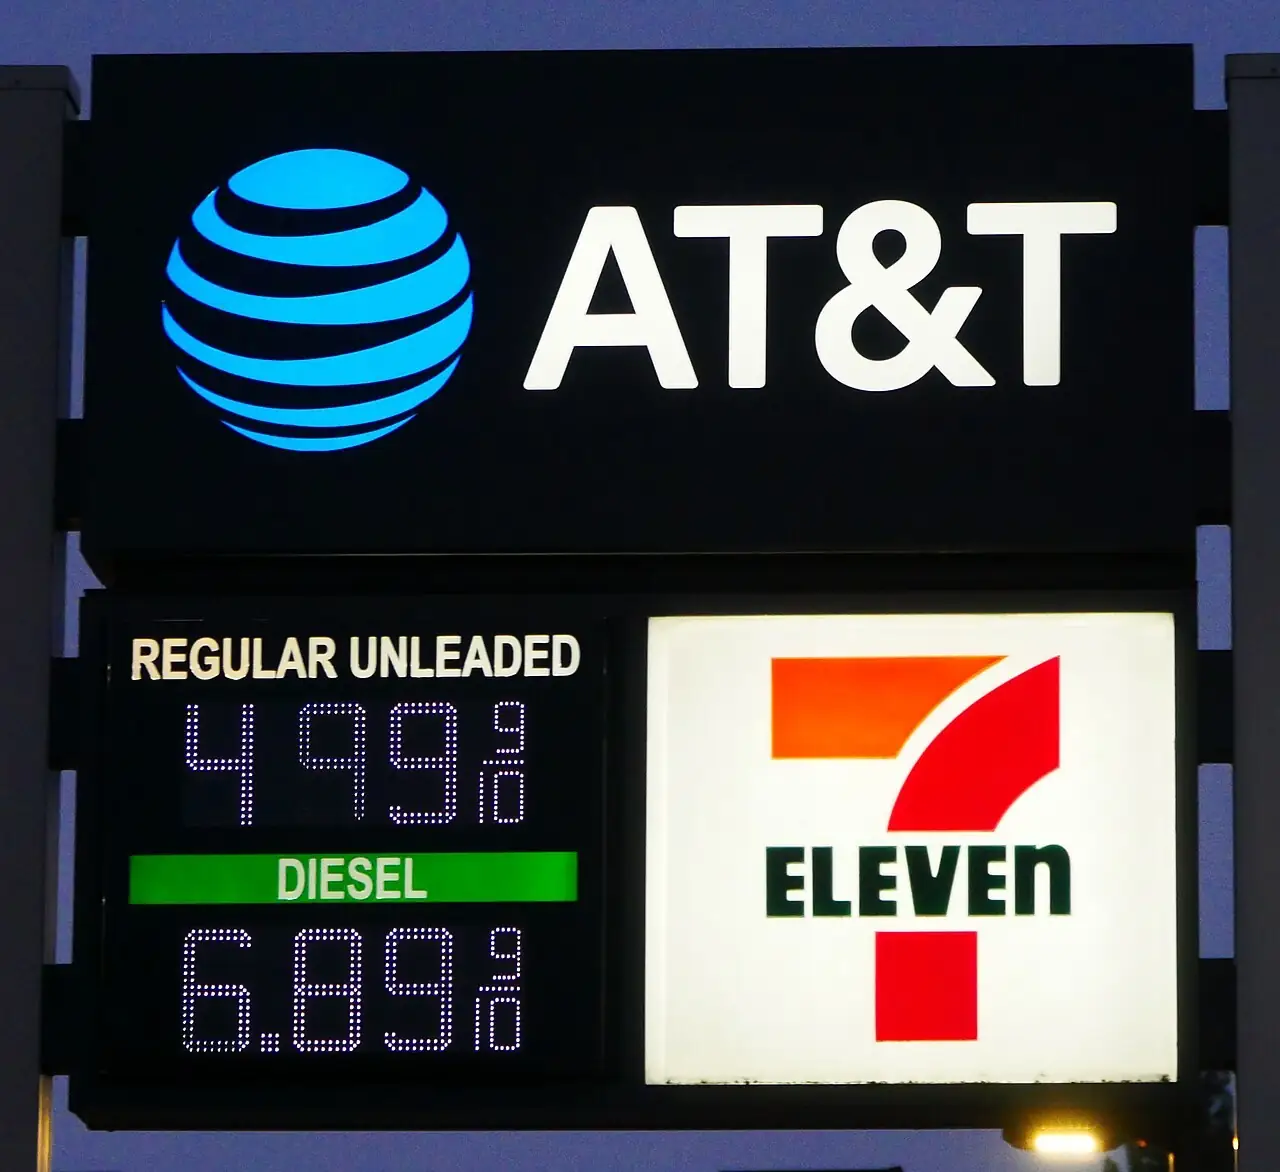
What a gallon of regular cost, week by week (2021–2026)

2Why now
3How we got here
- 1971Nixon ended the dollar's convertibility to gold (Aug. 15).9
- 1973An Arab oil embargo nearly quadrupled oil prices.10
- 1977Congress gave the Fed its "dual mandate": jobs and stable prices.11
- 1979–81A second oil shock. Paul Volcker's Fed let the federal funds rate approach 20%.12
- 2012The Fed formally adopted a 2% inflation target.13
- June 2022Inflation peaked at 9.1%, the highest in 40 years.14
- 2026Energy prices are rising again.
4Why it matters & what's next
- Your bills: credit-card rates usually rise soon after a Fed hike. Mortgage rates track the 10-year Treasury yield, about 5.1% on Oct. 21 (CNBC).7
- The Fed decides on Oct. 28. On Oct. 16, futures markets put the chance of another hike at about 15% (CNBC).8 Most traders expect a hold.
- That's a week before the Nov. 3 midterms.3
Want the full story, from 1971 to now?
Sources
Today’s news
- U.S. Bureau of Labor Statistics: Consumer Price Index, September 2026 (released Oct 14, 2026)
- Federal Reserve: FOMC statement (Sept 16, 2026)
- Bloomberg via World Oil: Oil hits $110 as Houthi strikes, Russia-Ukraine attacks lift supply fears (Oct 16, 2026)
- CNBC: Brent tops $109 after Houthis claim attacks on Saudi Arabia (Oct 18–19, 2026)
- U.S. Energy Information Administration: Weekly U.S. Regular All Formulations Retail Gasoline Prices (dollars per gallon), release of Oct. 20, 2026
- BBC: Why did US and Israel attack Iran and how long could the war last?
- CNBC: Treasury yields steady ahead of jobless claims and mortgage data (Oct 21, 2026)
- CNBC: Markets expect the Fed to hold rates in October. Kevin Warsh could surprise them (Oct 16, 2026)
The history
- Federal Reserve History: Nixon Ends Convertibility of U.S. Dollars to Gold
- Federal Reserve History: Oil Shock of 1973–74 and The Great Inflation
- Federal Reserve History: Federal Reserve Reform Act of 1977
- Federal Reserve History: Oil Shock of 1978–79 and Recession of 1981–82
- Federal Reserve: Statement on longer-run goals (Jan 25, 2012)
- BLS: Consumer prices up 9.1 percent over the year ended June 2022
It's easy to think of gas prices and interest rates as two separate worries: one shows up at the pump, the other on a loan statement. In fact they're connected, and Americans have watched that connection play out several times in the last half-century. The short version: when energy gets expensive, prices across the economy tend to follow. When prices rise too fast, the Federal Reserve's main tool is to make borrowing more expensive. That is why a jump in the price of oil can, eventually, show up in what you pay on a credit card.
From 1971 to now
Tap a year to see how energy and interest rates connect.
1971: Gold link ends
On Aug. 15, 1971, President Nixon ended the convertibility of dollars into gold, removing an old anchor for the value of money.
Read this era in the Long Read →1973: Oil embargo
An Arab oil embargo and production cuts nearly quadrupled the price of oil, from $2.90 a barrel to $11.65 by January 1974.
Read this era in the Long Read →1977: Dual mandate
Congress directed the Fed to pursue maximum employment and stable prices, along with moderate long-term interest rates.
Read this era in the Long Read →1979–81: Volcker
After a second oil shock, Paul Volcker's Fed let the federal funds rate approach 20% in late 1980 and early 1981.
Read this era in the Long Read →2012: 2% target
The Fed formally said 2% inflation, measured by the PCE price index, was most consistent with its mandate.
Read this era in the Long Read →2022: 9.1% peak
Consumer prices rose 9.1% in the year to June 2022, the biggest 12-month rise since November 1981 (BLS).
Read this era in the Long Read →2026: Now
Prices rose 3.7% in the year to September, with gasoline behind more than half of the monthly rise (BLS).
Read this era in the Long Read →The pump is back in the inflation story
On October 14, the U.S. Bureau of Labor Statistics (BLS) reported that consumer prices rose 3.7% in the 12 months to September, up from 3.4% in August. Over the month alone, prices rose 0.6%, and the BLS said the gasoline index, which jumped 9.1% in September, accounted for more than half of that monthly increase.1
What a gallon of regular cost, week by week (2021–2026)
Over a full year, the BLS figures show gasoline up 34.2% and energy overall up 20.4%. Fuel also feeds into other prices: airline fares, for example, were up 22.4% from a year earlier.1
Why "core" matters
Economists also watch core inflation, which strips out food and energy because those prices swing so much. Core inflation was 2.6% over the year to September, up from 2.4% in August, according to the BLS. Reuters reported that this was higher than the 2.5% economists it polled had expected, and quoted analysts who saw signs that price rises were spreading beyond energy.4
Oil and the Middle East
Behind the pump price is crude oil. On October 16, the global benchmark, Brent, hit $110 a barrel for the first time since May, Bloomberg reported.5 Over the following days, Iran-backed Houthi militants in Yemen claimed attacks on Saudi Arabia, including on Saudi Aramco facilities in Yanbu and the Shaybah oilfield. CNBC, which reported the claims, said it could not verify them.6 Reuters, via CNBC, reported that Brent touched a five-month high of $111.99 on October 20, amid attacks on tankers in the Gulf linked to the war with Iran, the conflict that began when the U.S. and Israel launched wide-ranging strikes on Iran on February 28, according to the BBC.73
The Fed has already moved once
On September 16, the Federal Reserve's rate-setting committee voted 12–0 to raise the target range for the federal funds rate by a quarter of a percentage point, to 3.75%–4%. "Inflation remains elevated," the statement said. Reuters described it as the first rate hike under the new Fed chair, Kevin Warsh.89 According to the minutes of that meeting, a couple of officials said higher rates would help keep price increases "stemming from energy market disruptions" from "broadening out."10
The dollar comes loose from gold
To see why oil and interest rates became so tightly linked, start in 1971. Since the end of World War II, the U.S. dollar had been tied to gold under the Bretton Woods system, and other currencies were tied to the dollar. On the evening of August 15, 1971, President Richard Nixon announced that the United States would end the convertibility of dollars into gold, along with wage and price controls, according to the Federal Reserve's own history site.14
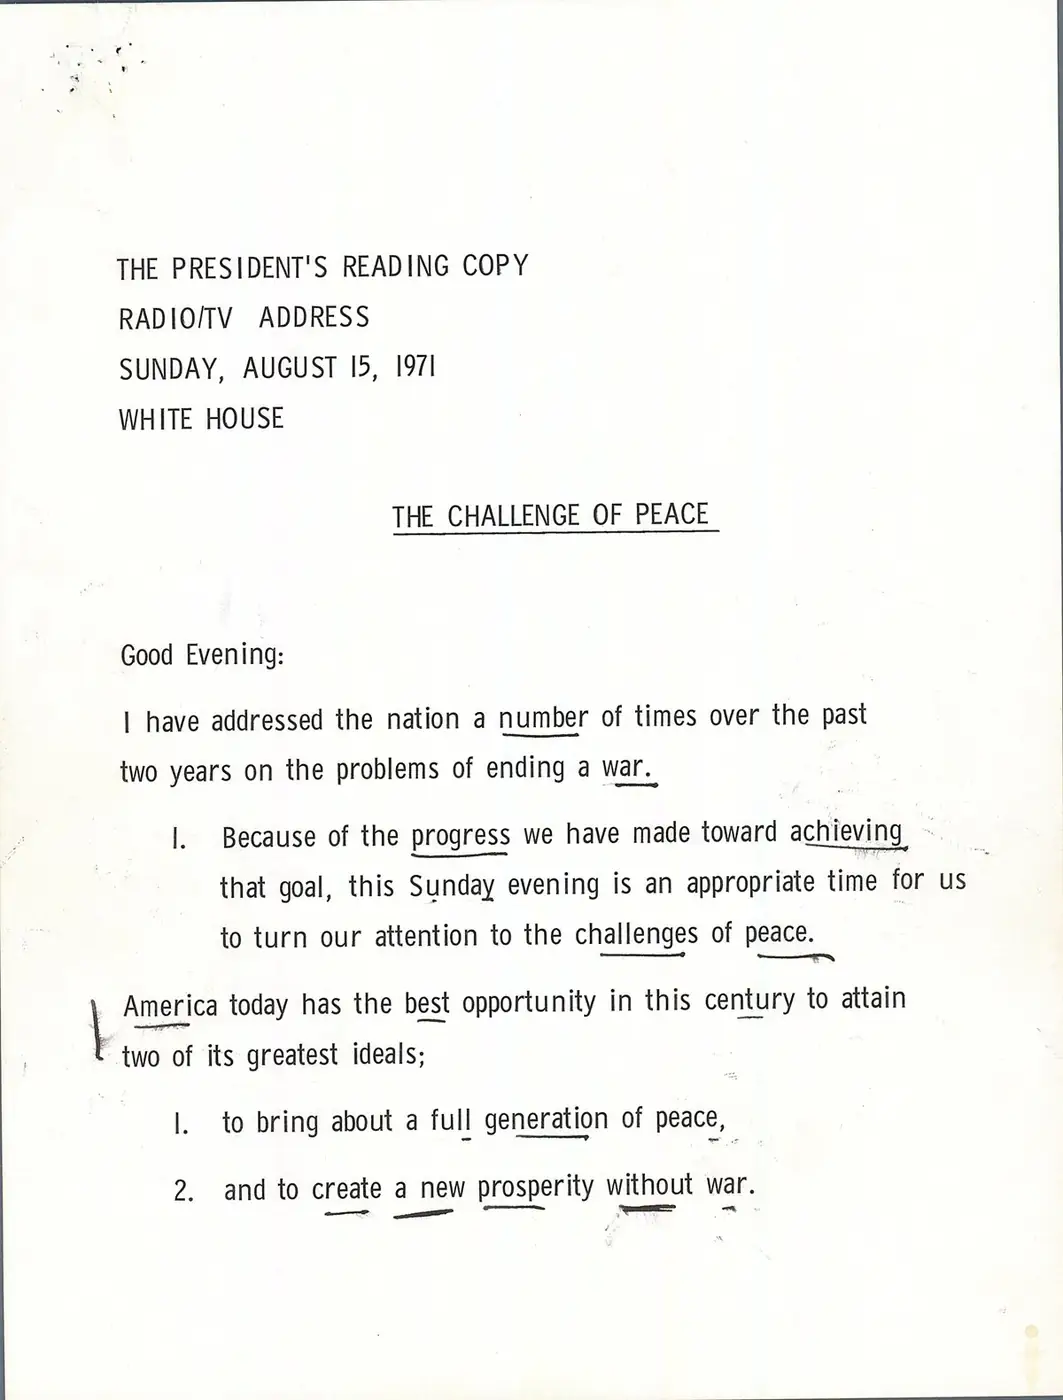
Nothing about that announcement made gas more expensive the next morning. But it removed an old anchor for the value of money. From then on, keeping inflation in check would depend much more on the decisions of the central bank.
Today’s echoIt's the Fed, not a link to gold, that has to decide how to answer 3.7% inflation at its Oct. 27–28 meeting.111
The first oil shock
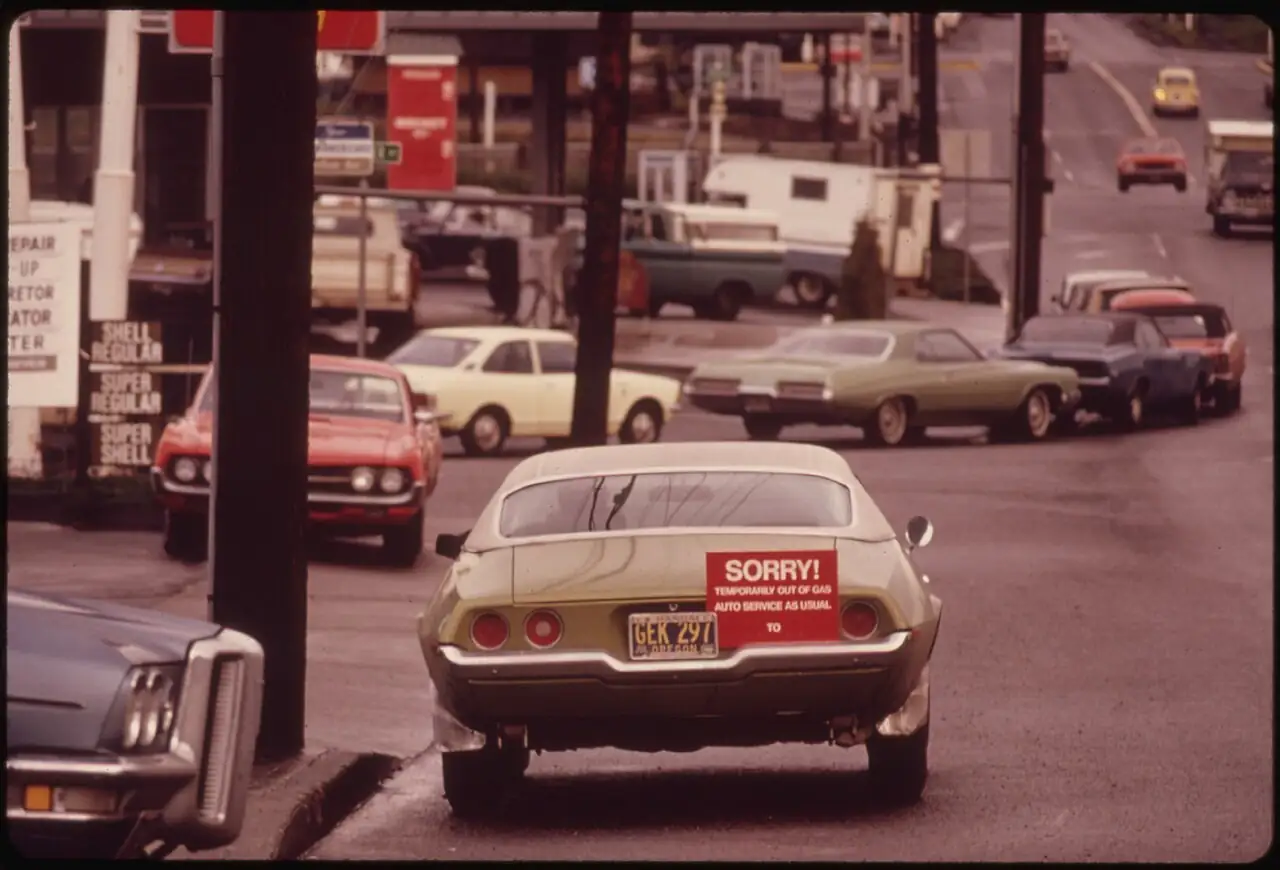
Two years later, the anchor was tested. In October 1973, during the Yom Kippur War, the Organization of Arab Petroleum Exporting Countries placed an oil embargo on the United States and began cutting production. Those cuts nearly quadrupled the price of oil, from $2.90 a barrel before the embargo to $11.65 in January 1974, according to Federal Reserve History.15

Stagflation
The 1970s gave Americans a new word: stagflation, a painful mix of high inflation and a weak economy with high unemployment. It was a problem the standard playbook struggled with. Fighting inflation could push unemployment higher, while fighting unemployment could push inflation higher.
Today’s echoBrent crude topped $110 a barrel after Houthi claims of attacks on Saudi oil sites, and gasoline drove more than half of September's rise in prices.561
Congress writes the Fed's job description
In 1977, Congress amended the Federal Reserve Act. The Federal Reserve Reform Act directed the Fed to "promote the goals of maximum employment, stable prices, and moderate long-term interest rates," as Federal Reserve History quotes it.16 The first two goals became known as the Fed's dual mandate: keep people working, and keep prices stable. That pairing explains why every rate decision is a balancing act. Raising rates can help with prices but risks jobs.
Today’s echoThe Fed's Sept. 16 statement noted that the unemployment rate "has changed little" while "inflation remains elevated," and called its rate hike "in support of the Federal Reserve's dual mandate."8
The second oil shock, and the Volcker cure
Then came a second shock. After the 1979 revolution in Iran, Iranian oil output fell by 4.8 million barrels a day, about 7% of world production at the time, and oil prices more than doubled between April 1979 and April 1980, according to Federal Reserve History.17
In August 1979, Paul Volcker became chair of the Fed. His answer to entrenched inflation was blunt. In late 1980 and early 1981, the Fed tightened so hard that the federal funds rate, the rate banks charge each other for overnight loans, approached 20%.17 (That is not the same as the prime rate that banks charge their customers, which is set higher.)
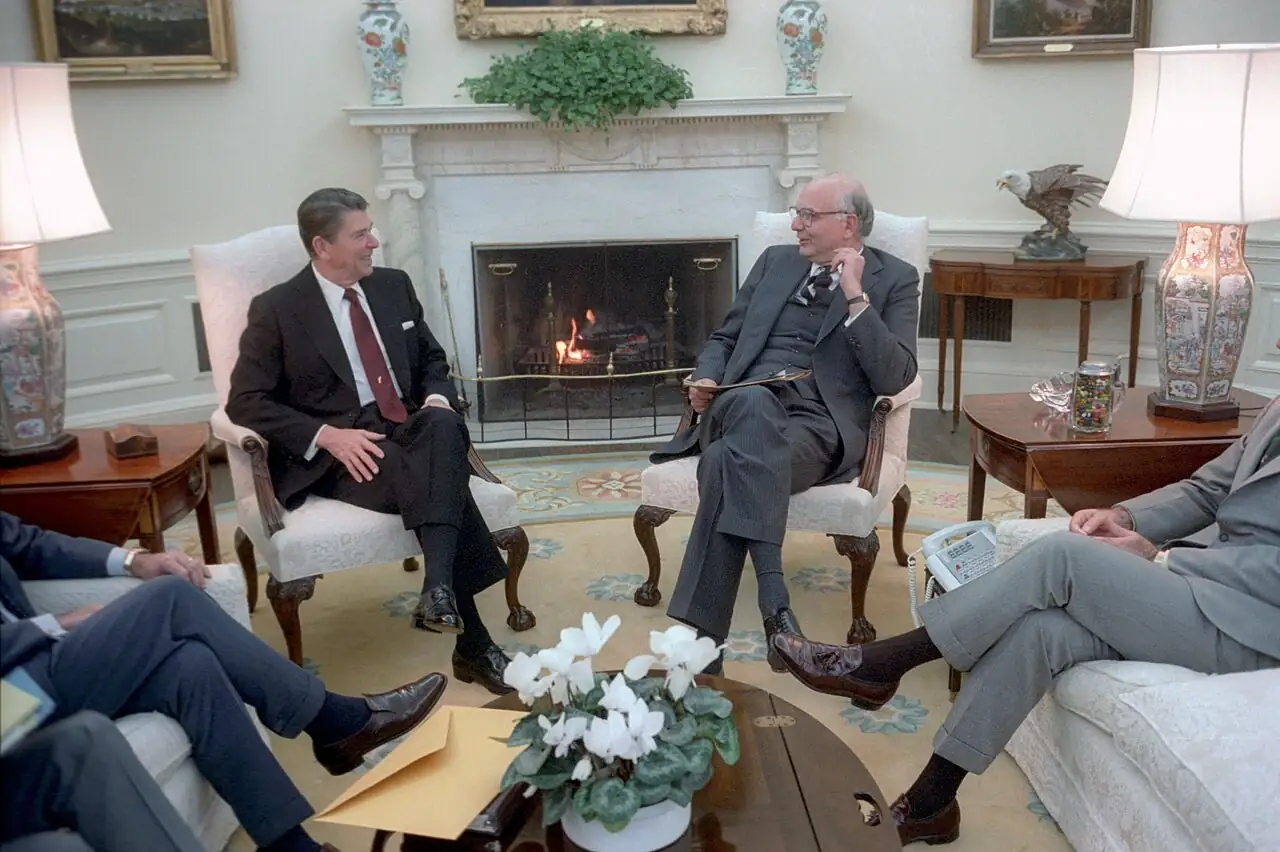

The price of the cure
The cure hurt. The U.S. fell into a deep recession, and unemployment peaked near 11% at the end of 1982. But by October 1982, inflation had fallen to 5%, according to Federal Reserve History. The episode set a template that still shapes the Fed: it showed that a central bank willing to raise rates sharply could break high inflation, at a real cost to jobs.
Today’s echoIn September the Fed raised its rate to 3.75%–4%, the first hike under Chair Kevin Warsh, saying "inflation remains elevated."89
Putting a number on "stable prices"
For decades, "stable prices" had no official number. That changed on January 25, 2012, when the Fed's rate-setting committee said that inflation of 2%, measured by the annual change in the price index for personal consumption expenditures (PCE), was most consistent with its mandate.18 The 2% target is why a 3.7% reading today is treated as a problem, not a curiosity.
You can see this todaywhen Warsh calls the Fed's 2% goal "a firm, fixed target" while inflation runs at 3.7%.111
The post-pandemic surge
The most recent test came after the pandemic. Over the 12 months ending in June 2022, consumer prices rose 9.1%, the biggest 12-month increase since November 1981, the BLS reported.19 Energy prices were up 41.6% over that year, and gasoline alone was up 59.9%.
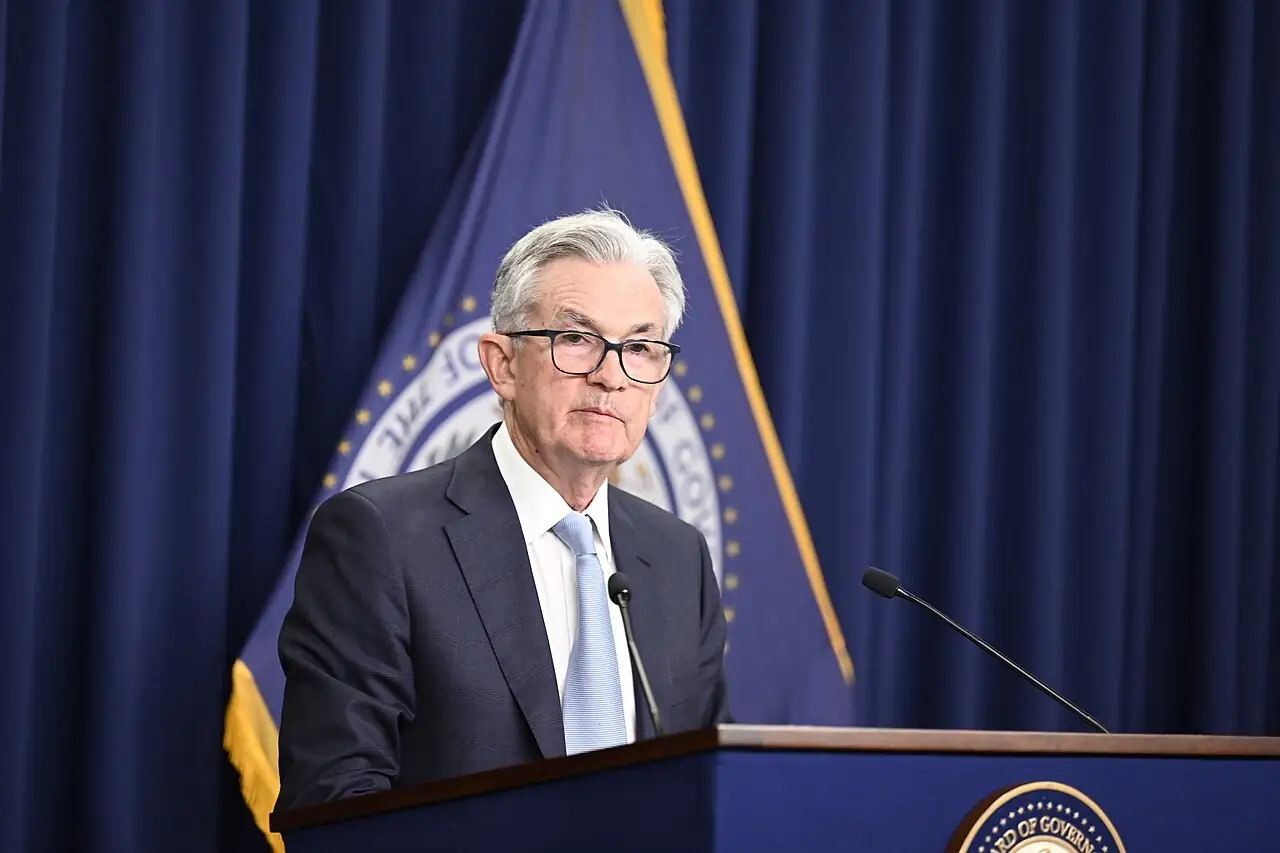

The Fed had begun raising rates in March 2022, lifting the federal funds target range to 0.25%–0.5% and signaling more increases to come.21 It did follow with more. At its peak, reached in July 2023, the federal funds target range stood at 5.25%–5.5%, according to the Fed's July 26, 2023 statement.22 For many households, that was the first time in years that rising rates showed up in their monthly bills.
The Fed’s main rate at four moments
Today’s echoBorrowing costs follow rates up: the 10-year Treasury yield, the main benchmark for mortgages, was about 5.1% on Oct. 21.12
How a rate hike reaches your bills
Here is the chain in plain terms. When the Fed raises the federal funds rate, banks pay more to borrow, and they pass that on.
Credit cards
Most credit cards have variable rates tied to the prime rate, which banks set based on the federal funds rate. In the Fed's daily data, the bank prime loan rate stood at 7%, three points above the top of the Fed's 3.75%–4% range.13 So when the Fed raises its rate, card rates usually rise soon after, and any balance you carry costs more.
Mortgages
Fixed mortgage rates don't follow the Fed directly. They track longer-term borrowing costs, especially the 10-year Treasury yield, which CNBC calls "the main benchmark for mortgages, auto loans and credit card debt."12 The Fed's daily data put the 10-year yield at 5.21% on October 13 and 5.15% on October 19, and CNBC reported it at about 5.1% on October 21.1312 A fixed-rate mortgage you already have won't change. New mortgages, adjustable-rate loans and home-equity lines are the ones that feel it.
Savings
There is a flip side: when rates rise, savers tend to earn more on savings accounts and Treasury bills.
What to watch
The Fed's October 27–28 meeting. Markets see another hike as possible, not likely. Reuters reported that right after the September inflation data, futures were priced for around even odds of an October hike.4 By October 16, CNBC reported, futures put the probability at about 15%, after Fed Vice Chair Philip Jefferson and New York Fed President John Williams signaled little urgency to raise rates.11 Warsh himself said he wasn't signaling a decision either way. In September, the median Fed official projected one more hike in 2026, which, CNBC noted, left room to pause in October and move later.
Oil and the Middle East. Any further attacks on Saudi oil sites or Gulf shipping could push crude, and then pump prices, higher. Rootread will have more on the roots of the conflict in Yemen.
The next inflation report. The BLS is scheduled to publish October's consumer price figures on November 10.1
The calendar. The Fed's decision comes about a week before the November 3 midterm elections, so inflation and interest rates will be fresh news when voters head to the polls.
The deeper pattern is the one this story began with. Since 1971, the big energy shocks have repeatedly tested the Fed. In the 1970s, by the Fed's own historical account, inflation got away from it for years; in the early 1980s it broke inflation at a high price; in 2022 it raised rates fast. Whether 2026 calls for more of the same is the question the Fed meets next week to answer.
This is a developing story. Figures reflect reporting and official data available as of October 21, 2026. Market odds change daily.
Sources
Today’s news
- U.S. Bureau of Labor Statistics: Consumer Price Index, September 2026 (released Oct 14, 2026)
- U.S. Energy Information Administration: Weekly U.S. Regular All Formulations Retail Gasoline Prices (dollars per gallon), release of Oct. 20, 2026
- BBC: Why did US and Israel attack Iran and how long could the war last?
- Reuters (via Investing.com): Fed rate hike call seen tight as inflation heats up (Oct 14, 2026)
- Bloomberg via World Oil: Oil hits $110 as Houthi strikes, Russia-Ukraine attacks lift supply fears (Oct 16, 2026)
- CNBC: Brent tops $109 after Houthis claim attacks on Saudi Arabia (Oct 18–19, 2026)
- CNBC/Reuters: Oil rises on Middle East supply worries (Oct 20–21, 2026)
- Federal Reserve: FOMC statement (Sept 16, 2026)
- Reuters: Fed raises rates in search of 'timelier' drop in inflation (Sept 16, 2026); Reuters live: first hike under Warsh
- Federal Reserve: Minutes of the Sept 15–16, 2026 FOMC meeting
- CNBC: Markets expect the Fed to hold rates in October. Kevin Warsh could surprise them (Oct 16, 2026)
- CNBC: Treasury yields steady ahead of jobless claims and mortgage data (Oct 21, 2026)
- Federal Reserve: H.15 Selected Interest Rates (Oct 20, 2026 release)
The history
- Federal Reserve History: Nixon Ends Convertibility of U.S. Dollars to Gold
- Federal Reserve History: Oil Shock of 1973–74 and The Great Inflation
- Federal Reserve History: Federal Reserve Reform Act of 1977
- Federal Reserve History: Oil Shock of 1978–79 and Recession of 1981–82
- Federal Reserve: Statement on longer-run goals (Jan 25, 2012)
- BLS: Consumer prices up 9.1 percent over the year ended June 2022
- Federal Reserve: FOMC statement (June 15, 2022)
- Federal Reserve: FOMC statement (March 16, 2022)
- Federal Reserve: FOMC statement (July 26, 2023)
Short on time? Get it in 90 seconds.